Welcome to MultiOmicsXplorer - User Guide
Learn how to use the features of the MultiOmicsXplorer app.
Introduction
MultiOmicsXplorer is a tool for analyzing phosphoproteomic, proteomic, and transcriptomic data from various types of tumors. The app allows you to compare tumors at different stages and analyze molecular data across multiple layers of omics.
OncoXplorer-CPTAC Data Analysis
The OncoXplorer-CPTAC Data Analysis section lets you compare tumor data from the CPTAC portal across various tumor types and stages.
Extract Protein Activity from Your Data
This section allows you to use SignalingProfiler to extract protein activity by uploading your own data.
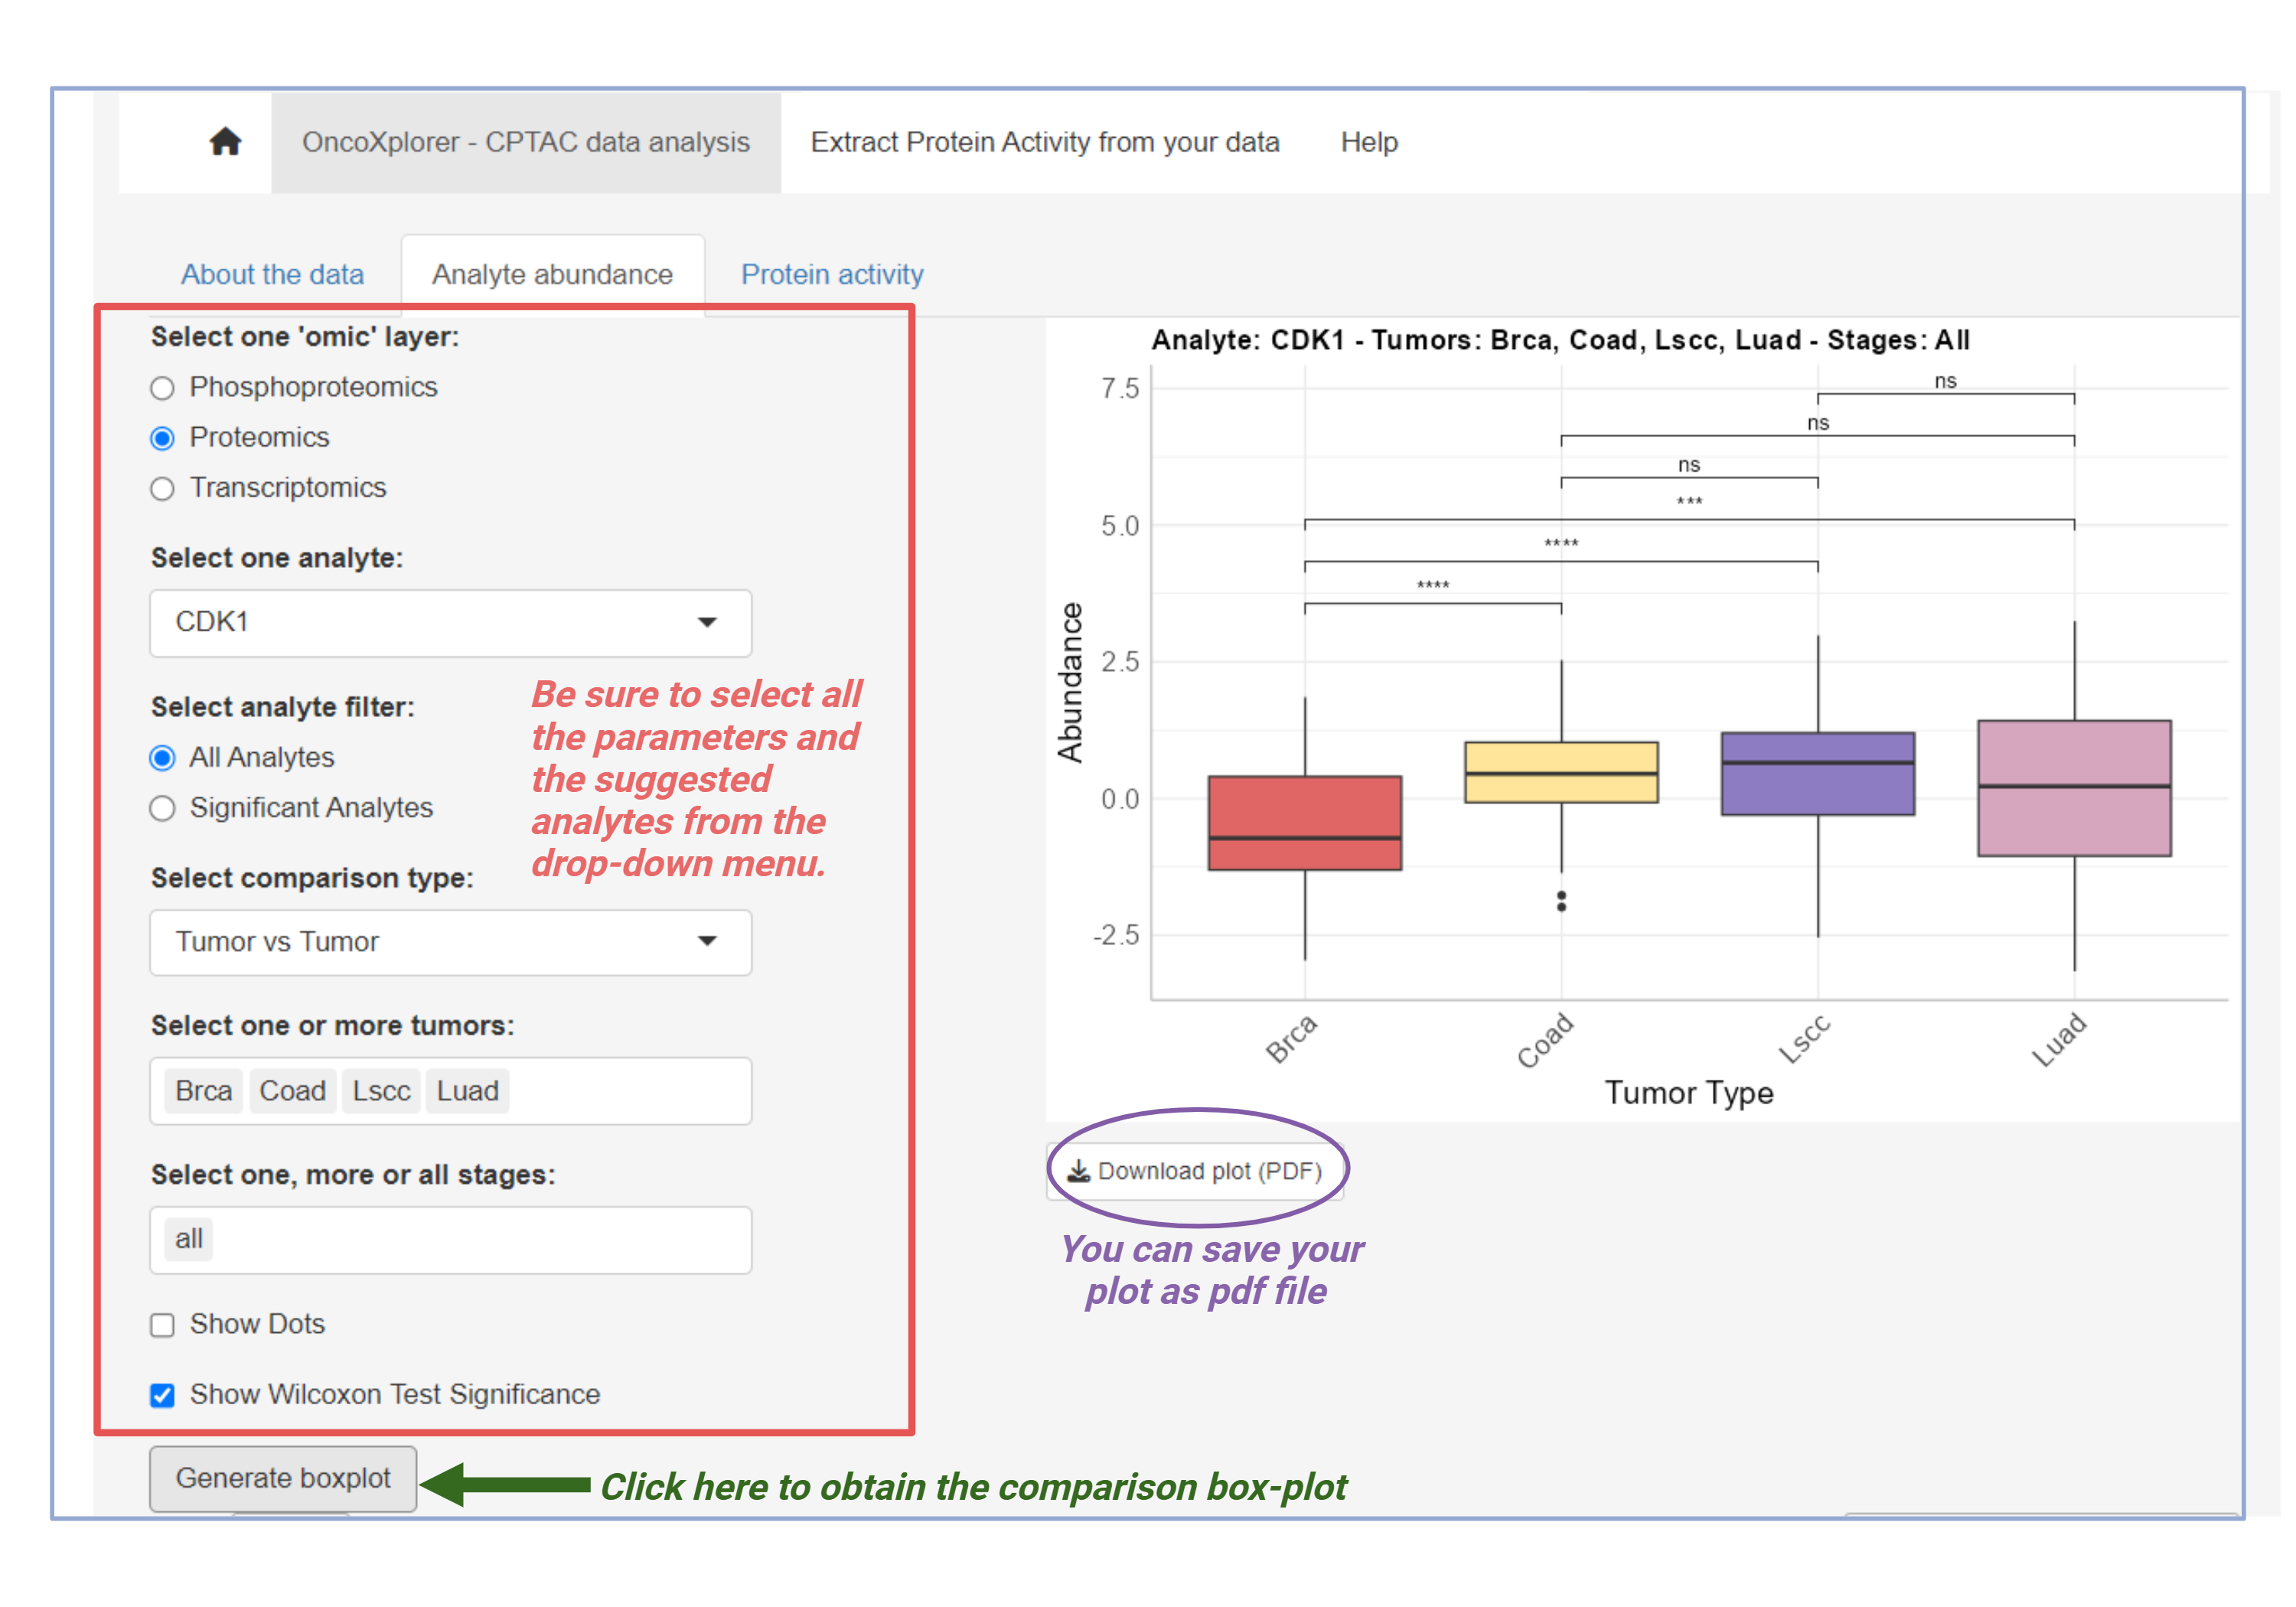
Analyte Abundance
In this section, you can analyze the abundance of analytes from different 'omic' layers: Phosphoproteomics, Proteomics, or Transcriptomics. Choose your desired dataset and comparison type, then generate plots to visualize the results.
- Select an 'omic' layer (Phosphoproteomics, Proteomics, or Transcriptomics).
- Choose a comparison type (Tumor vs Tumor or Tumor vs Normal).
- Select one or more tumors and stages for your analysis.
Click the Generate boxplot button to visualize the data.
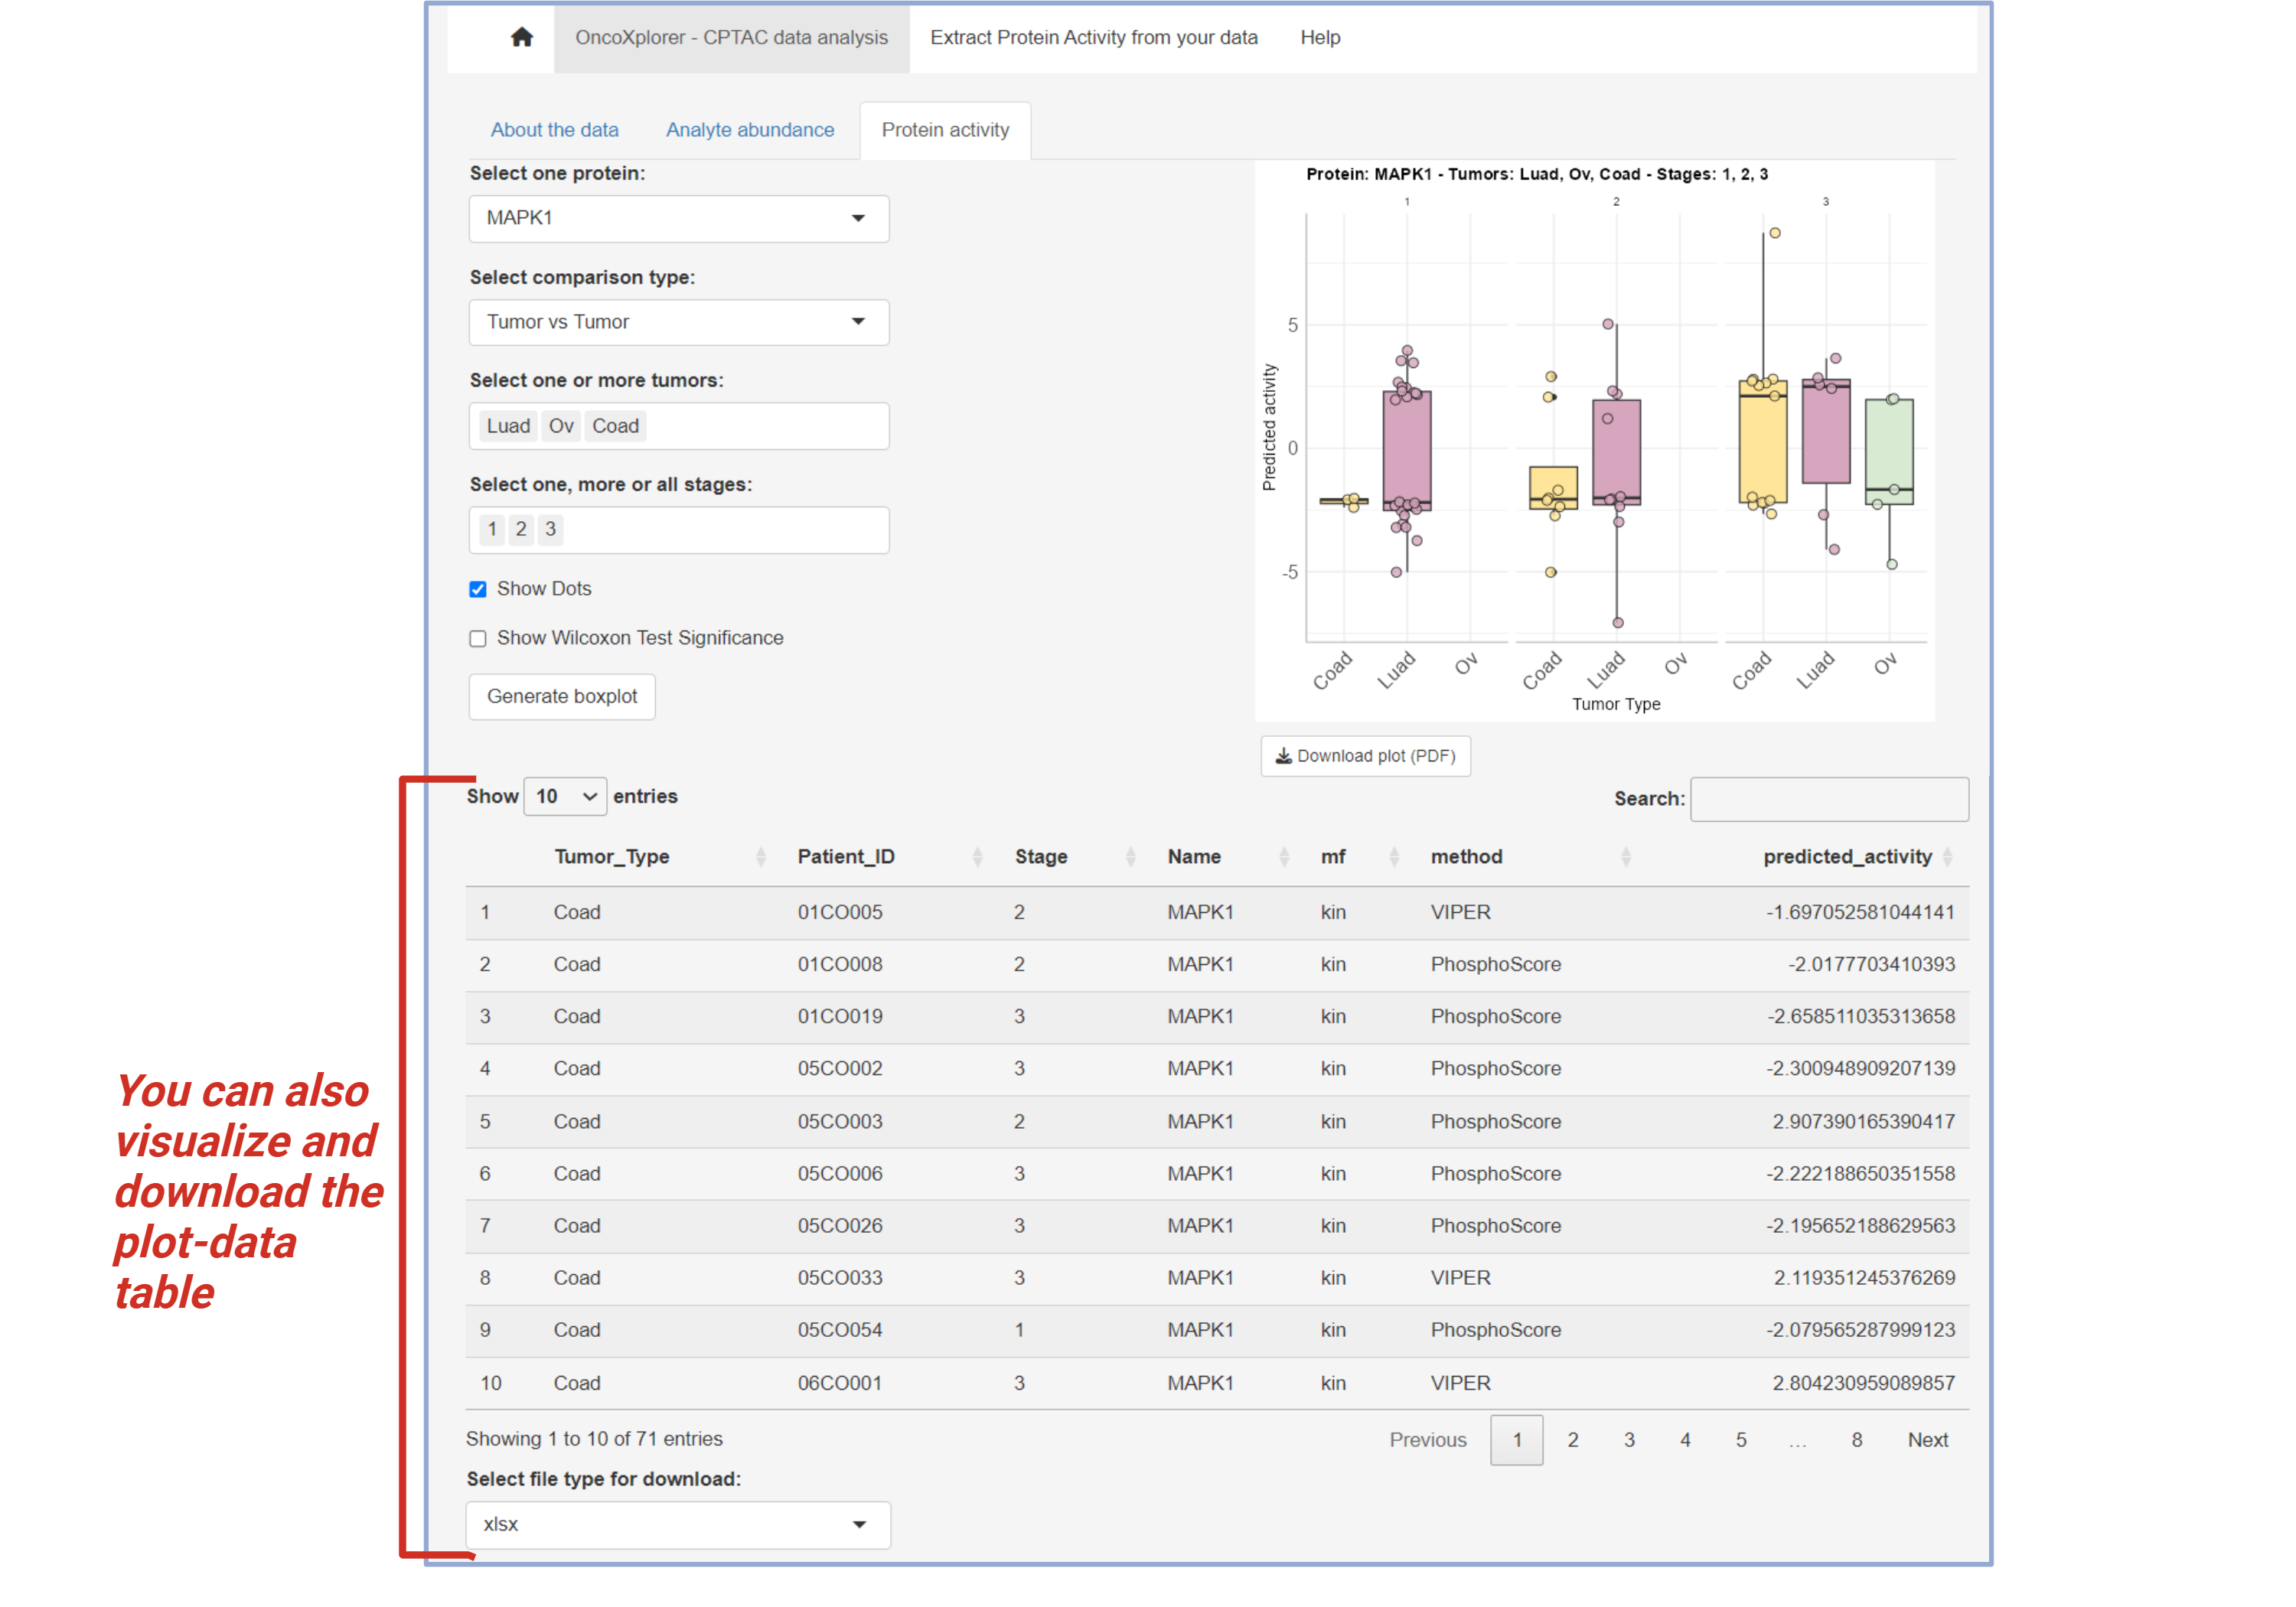
Protein Activity
The Protein Activity section allows you to analyze protein activity and compare it between different tumors or stages. Select the protein, comparison type, and the relevant tumor and stage(s) to visualize protein activity.
- Choose a protein from the list.
- Select the comparison type (Tumor vs Tumor or Tumor vs Normal).
- Select one or more tumors and stages to compare.
Click the Generate boxplot button to view the results.
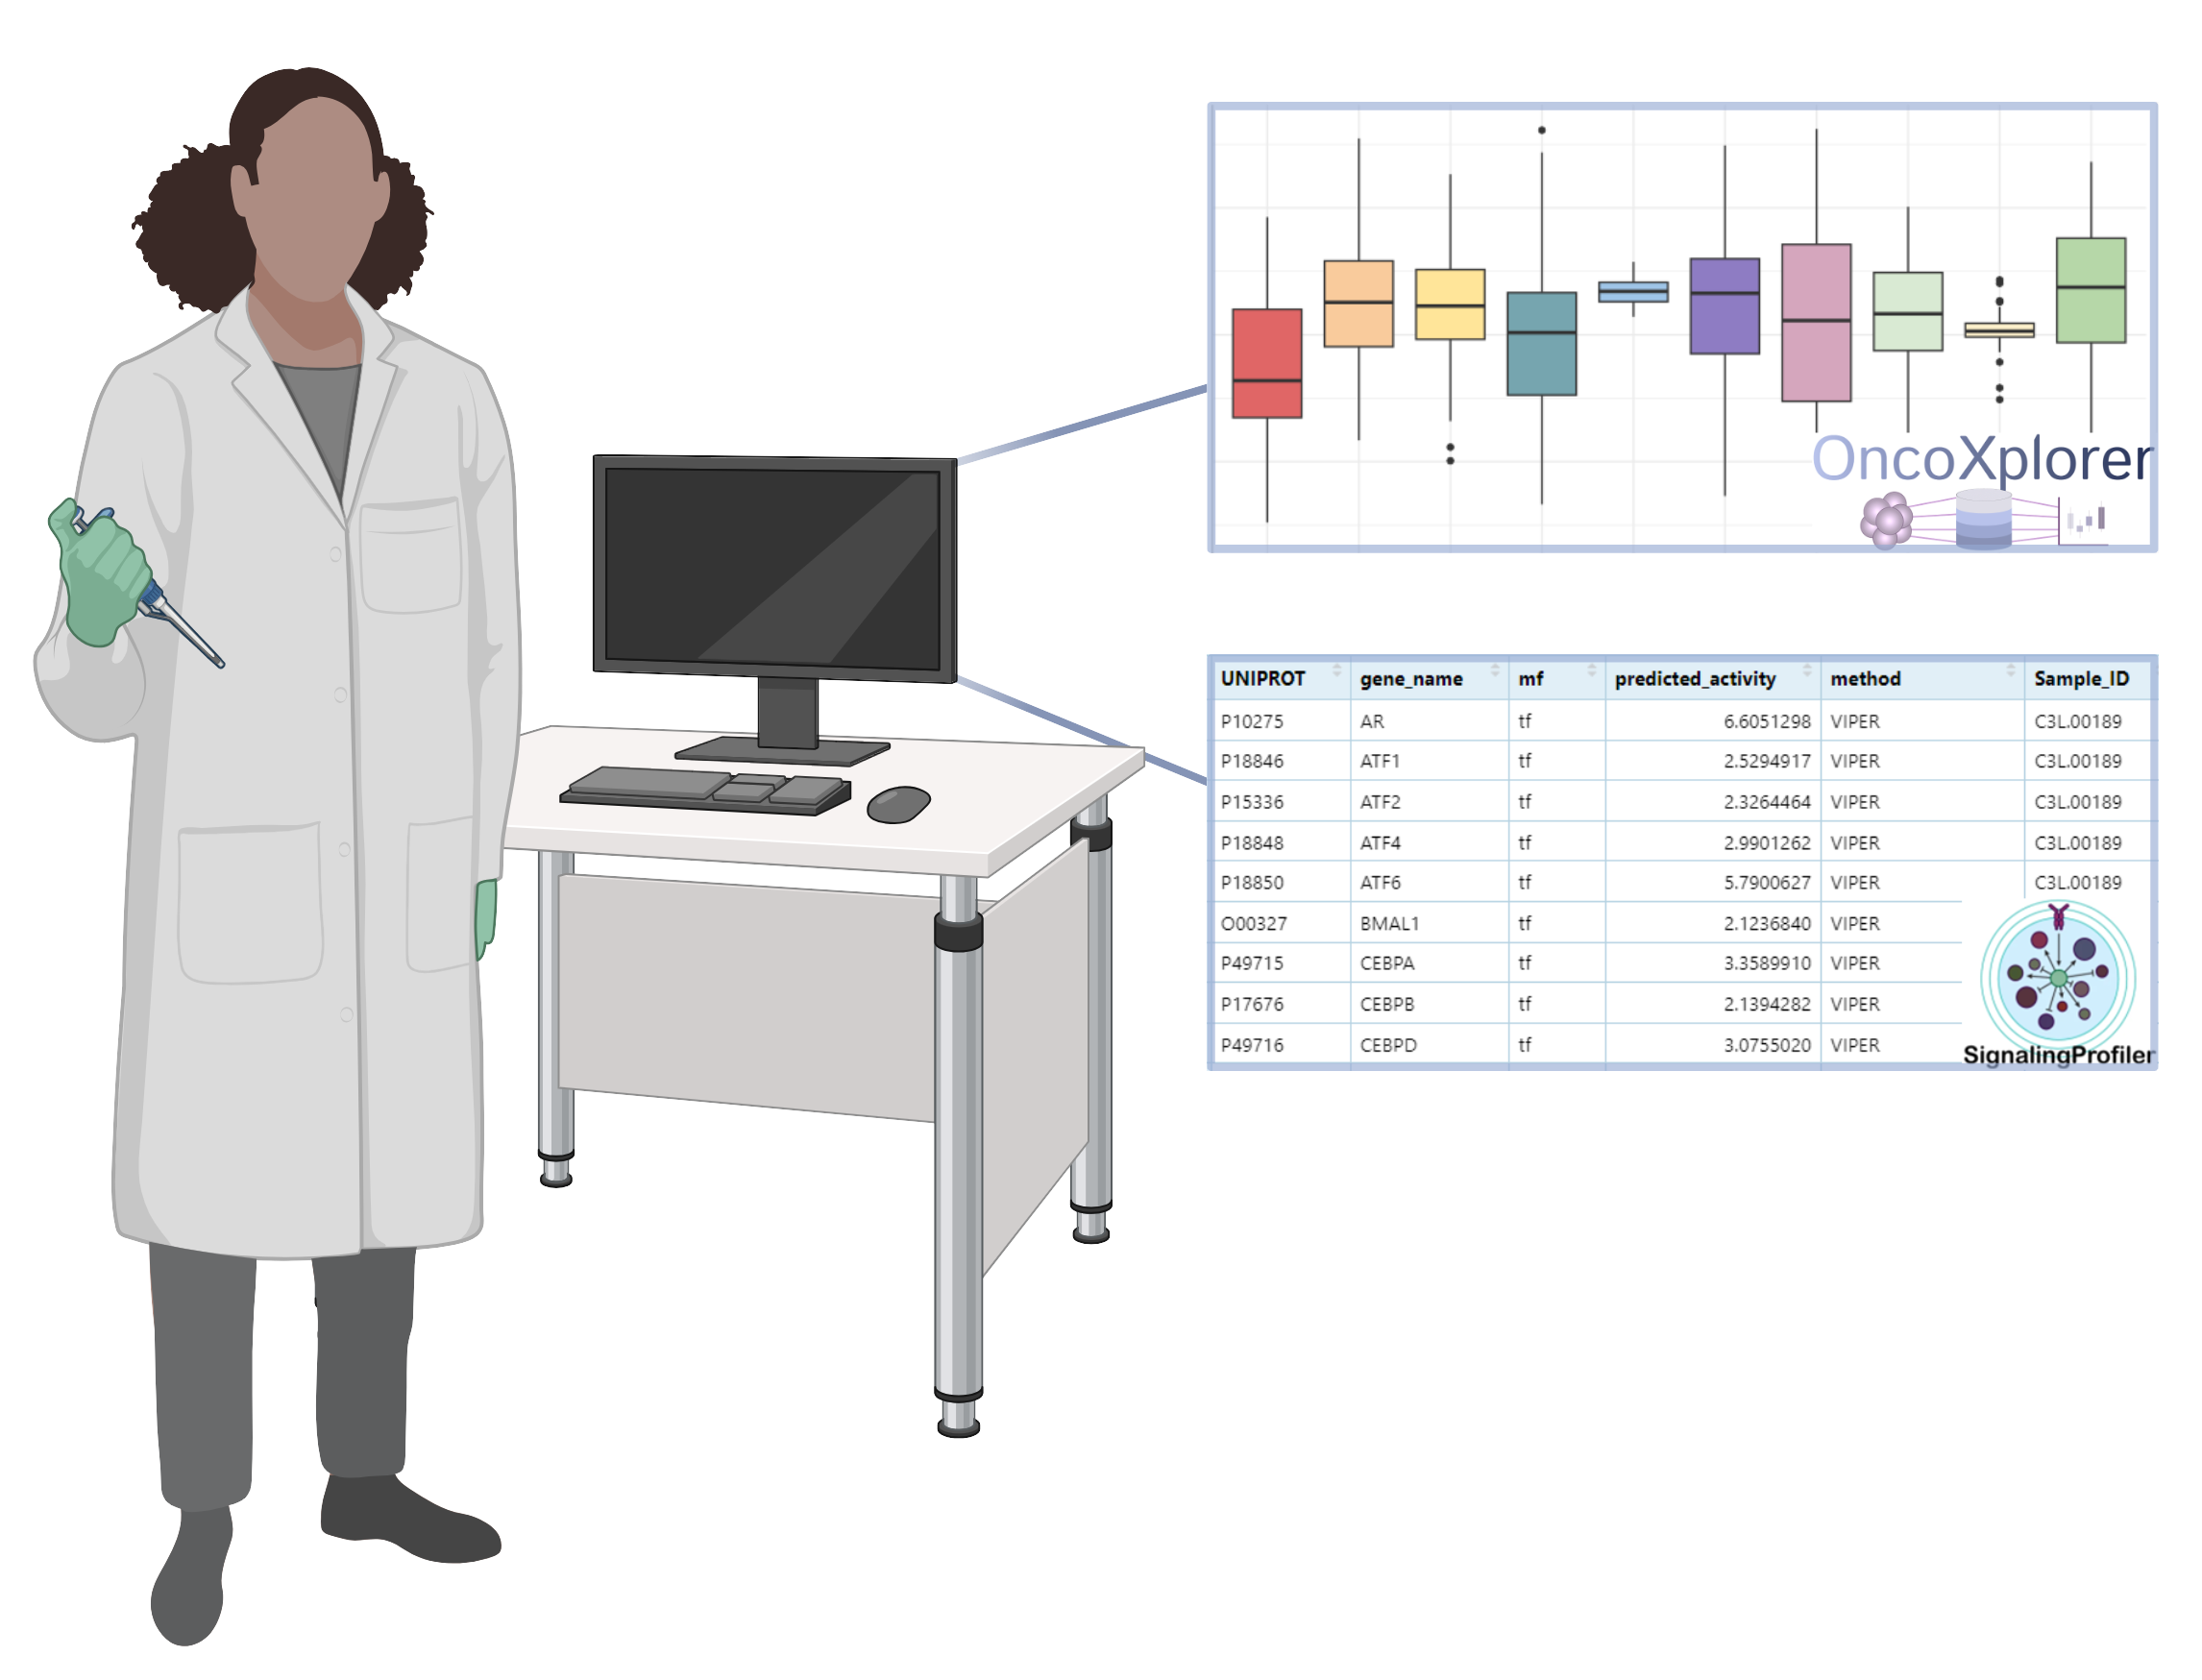
SignalingProfiler
The SignalingProfiler tool enables the extraction of protein activity from your own data. Here, you'll learn how to upload your dataset, run the analysis, and interpret the results.
About SignalingProfiler
SignalingProfiler provides a method for inferring protein activity from proteomics, phosphoproteomics, and transcriptomics data. This tool calculates activity levels of transcription factors, kinases, phosphatases and other proteins, offering insights into signaling pathways and cellular activity.
Steps to Use SignalingProfiler
- Upload Your Data: Choose the relevant data type (proteomics, phosphoproteomics, or transcriptomics) and upload your dataset.
- Choose Settings: Select analysis parameters (default or personalized).
- Run the Analysis: Once data is uploaded and settings are configured, click on the Run Analysis button.
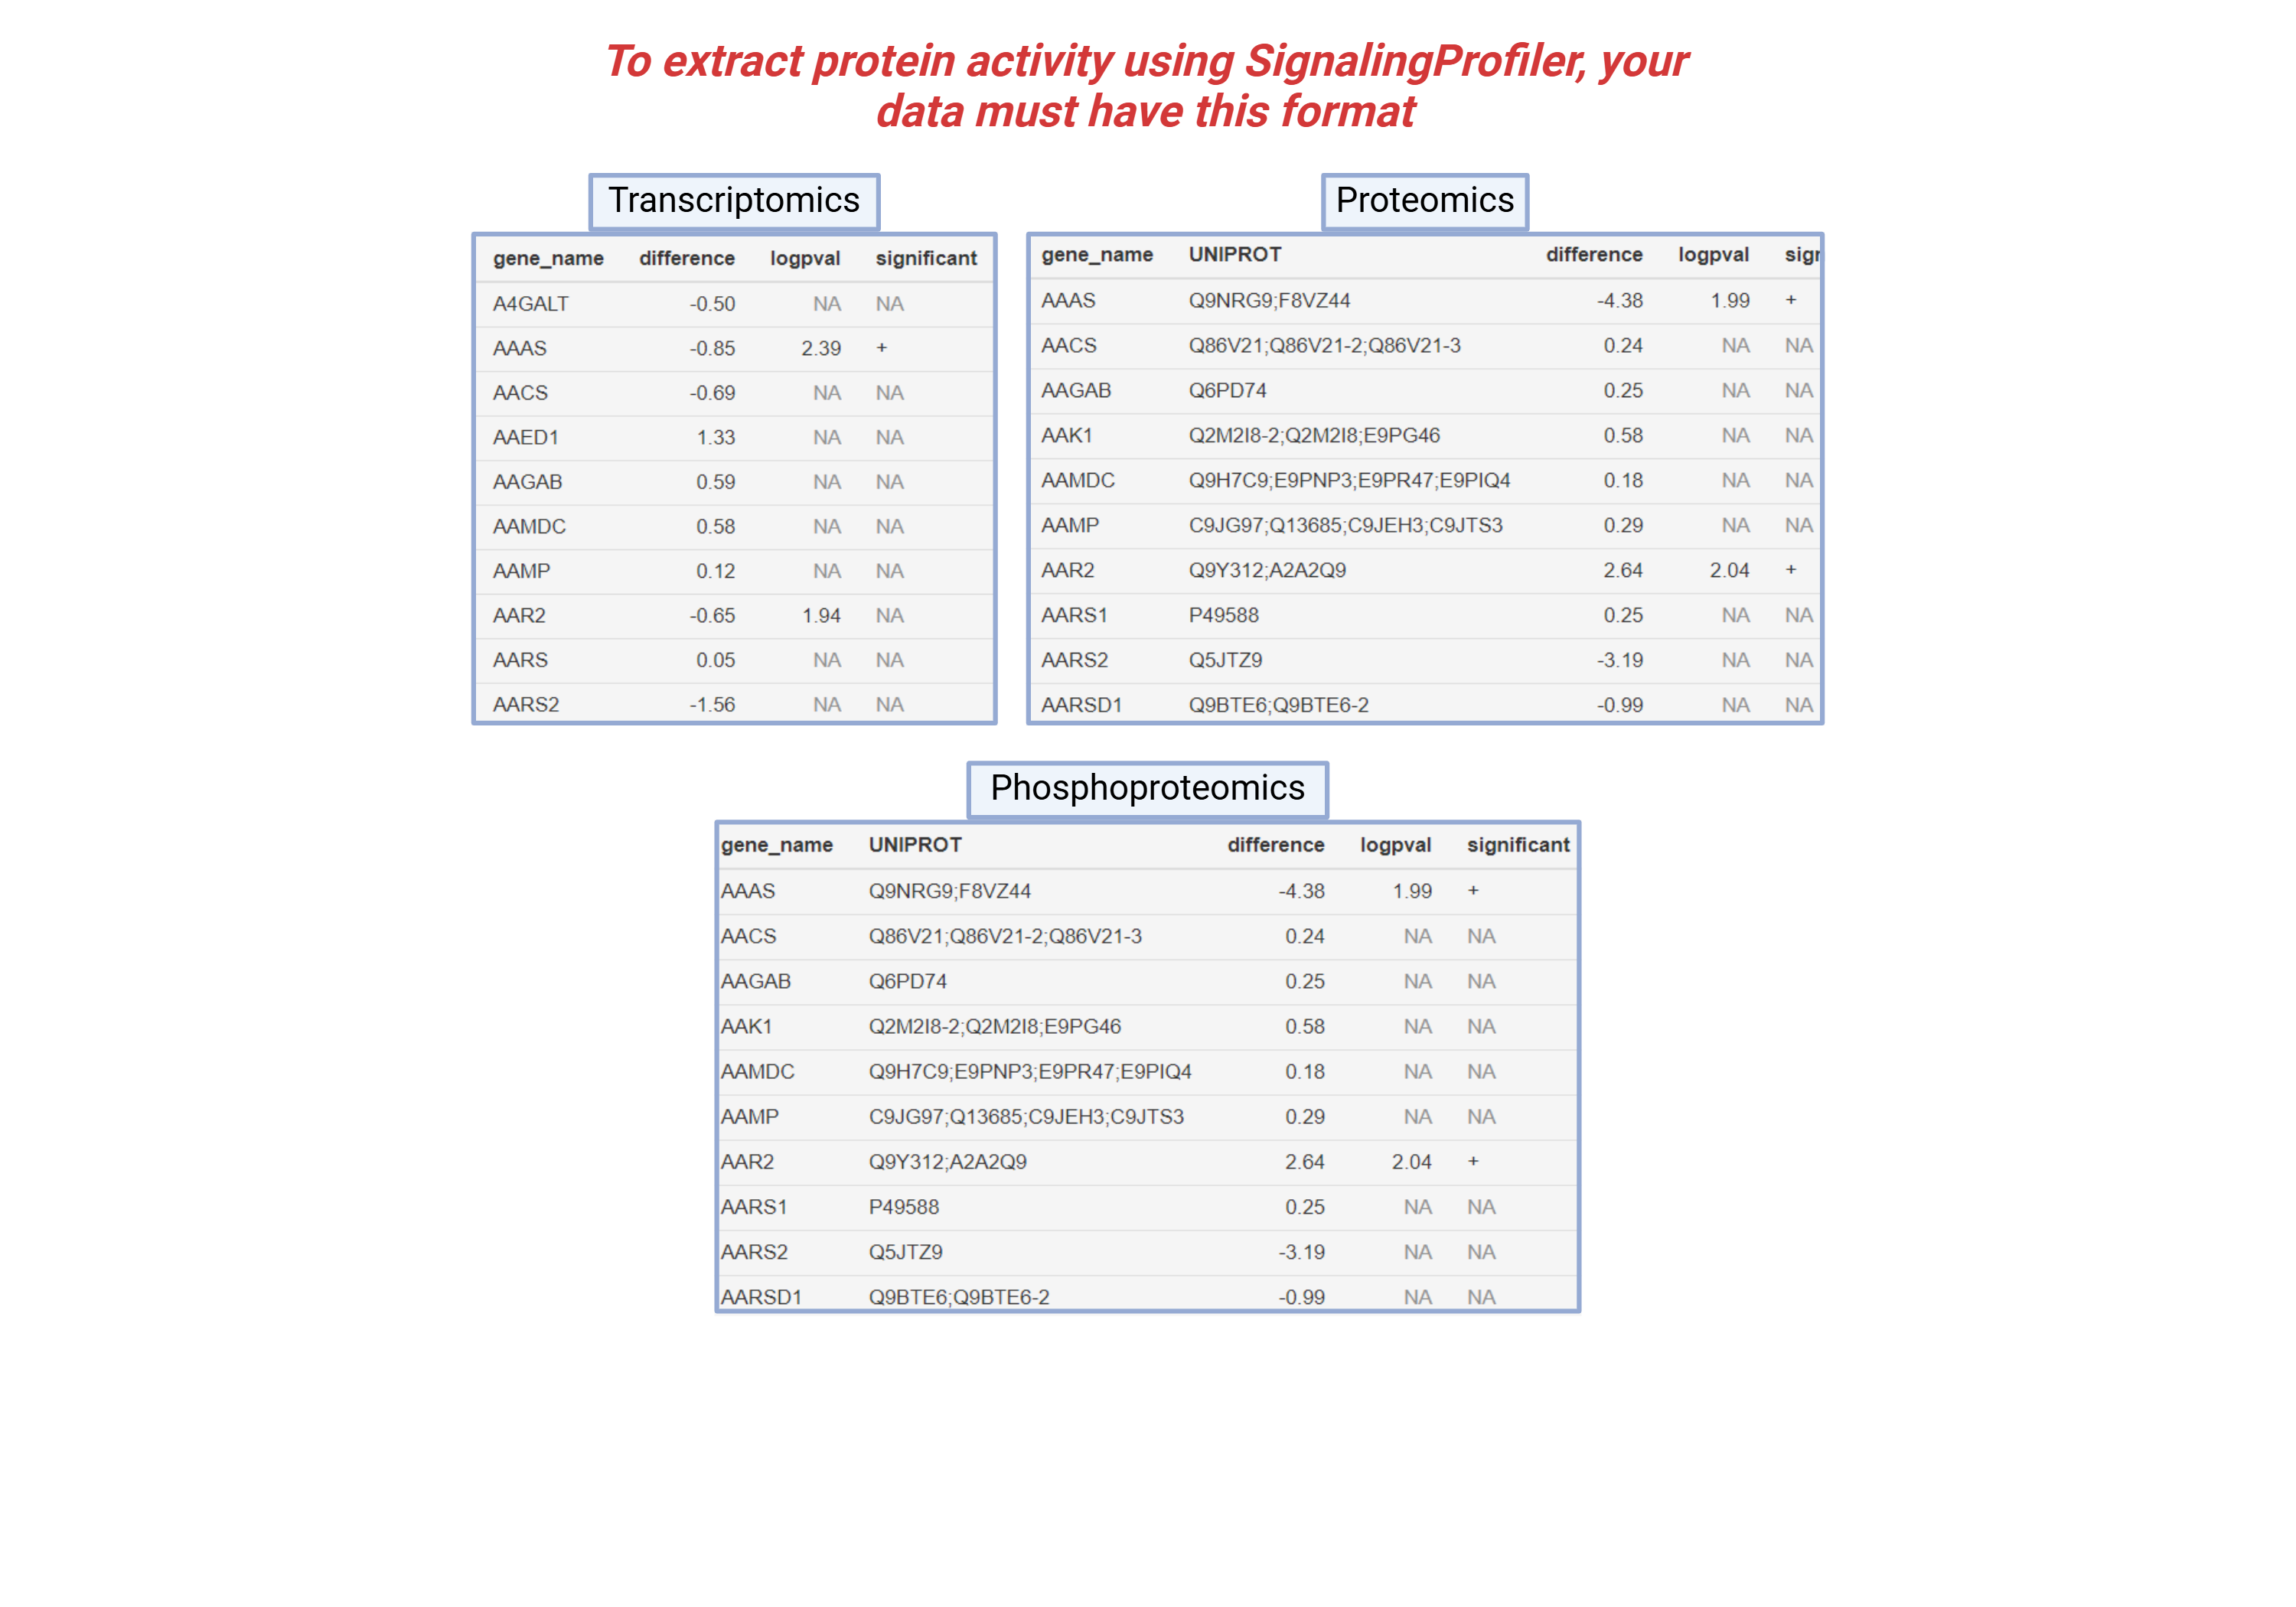
Example Data Format
To run the analysis successfully, your data must follow the correct format:
- Proteomics: File with protein identifiers and corresponding intensity values.
- Phosphoproteomics: File with phosphosite identifiers and phosphorylation levels.
- Transcriptomics: File with gene identifiers and expression levels.
You can upload your files, respecting the format of the names shown in the image. You can choose the default parameters used by SignalingProfiler or you can also personalize the parameters for the analysis.
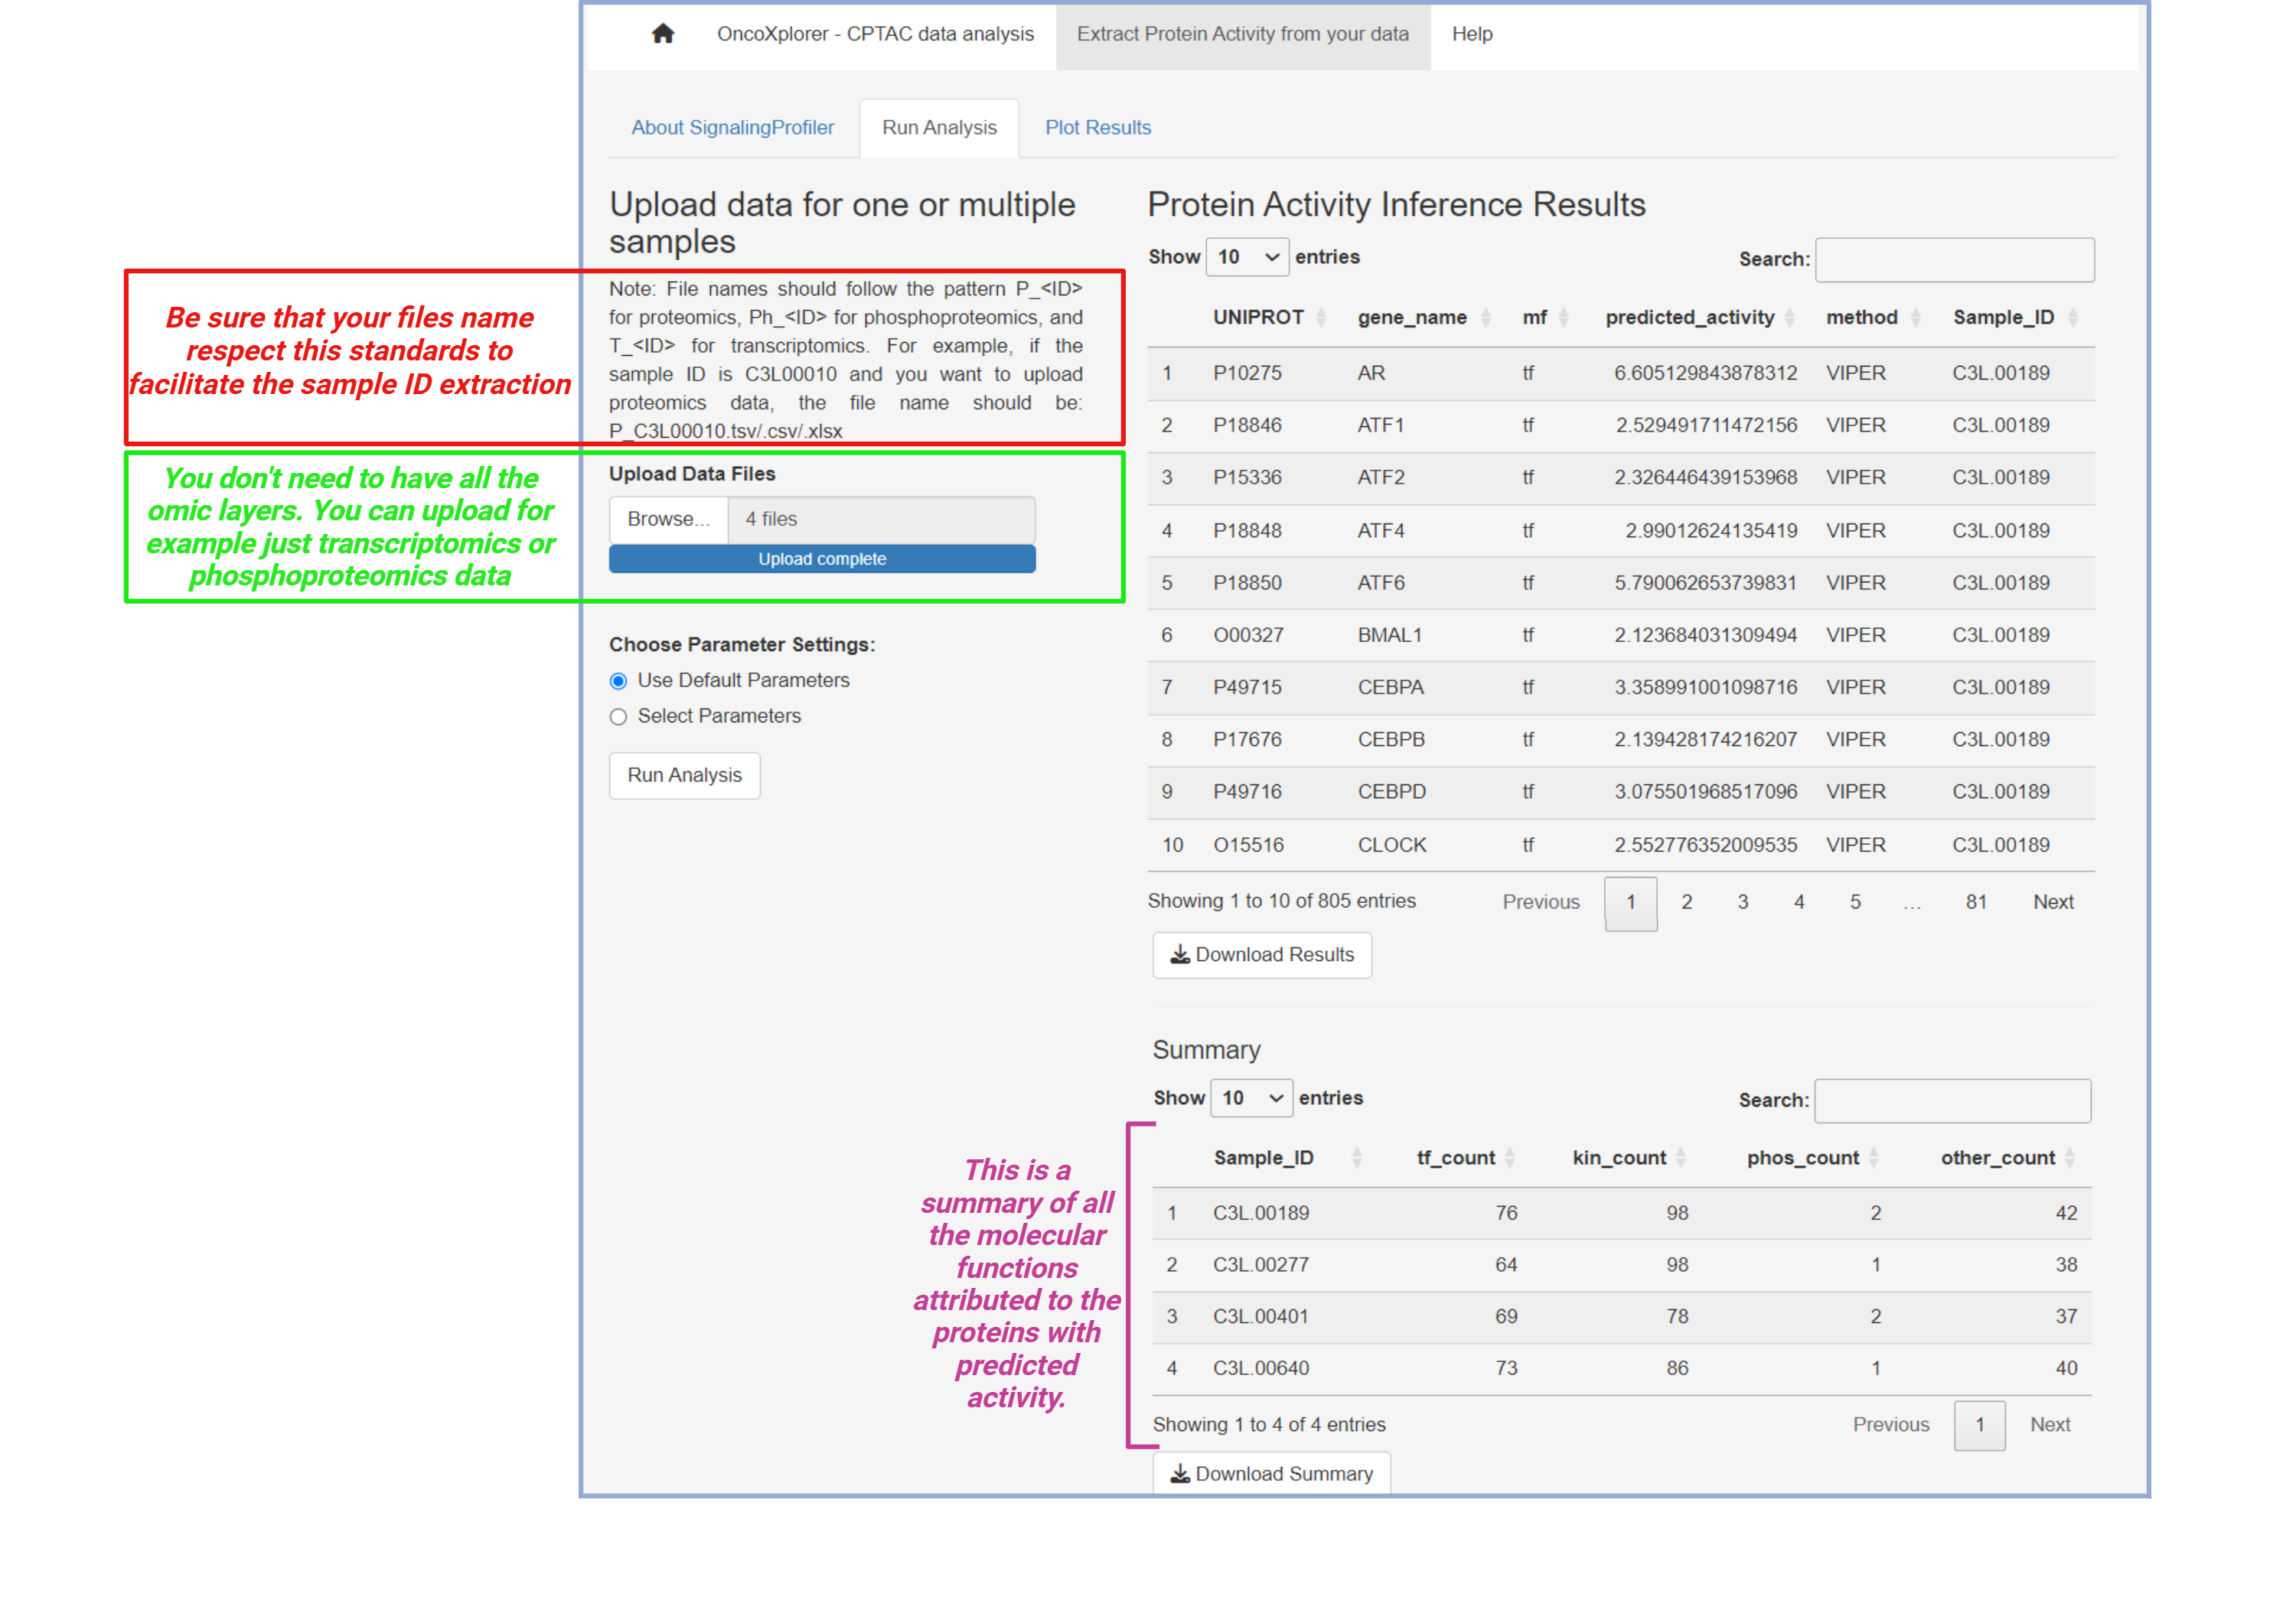
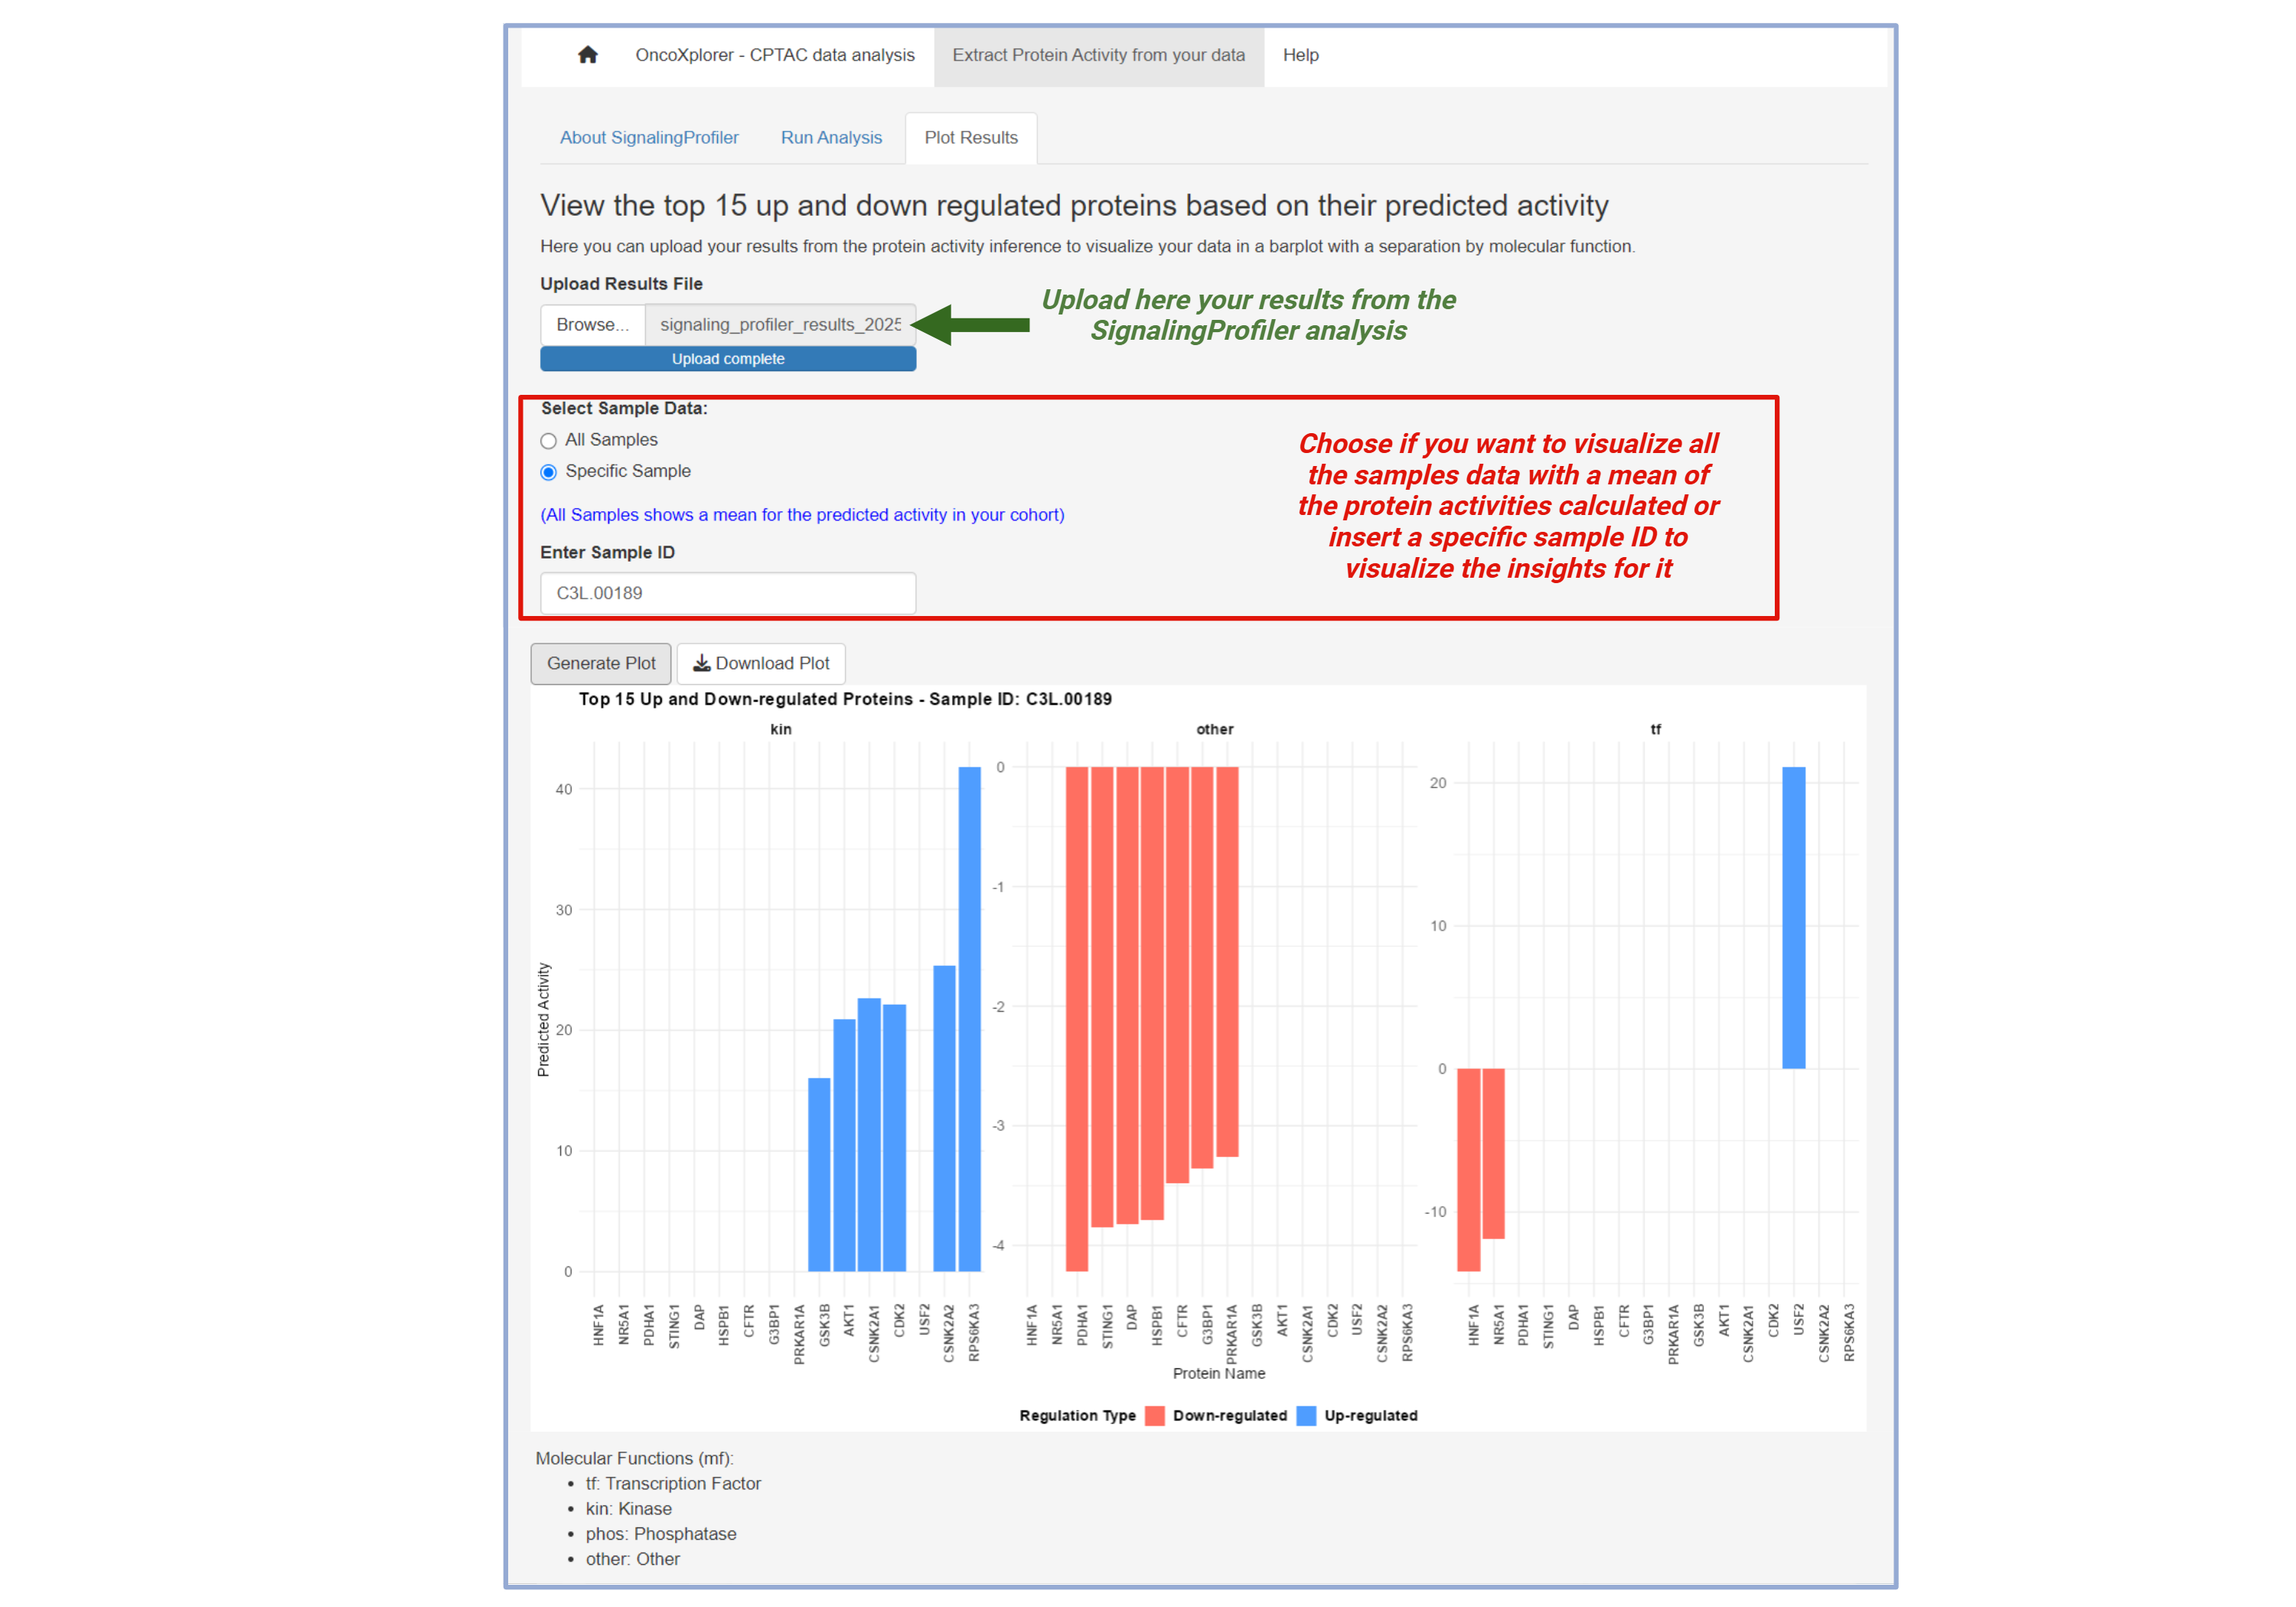
Visualize Results
Once the analysis is completed, you can visualize the results in a series of plots showing protein activity. The top proteins will be highlighted based on their inferred activity.